Patient Profile
In this page the patient information given in the Patient Profile screen is described and presented. The description of the terms shown as links (blue font color) in the text can be found in the Terminology page of this wiki. By clicking them, the page will be redirected to the corresponding section that the clicked term is located in the Terminology page.
Contents
Figure 1 = Patient Profile Full Screen The Patient Profile screen is divided in three sections:
- The Patient's Demographics and Covid-19 Severity Assessment (the Header of the screen as shown in Figure 1).
- The Patient Summary and Charts (Main Body of the screen as shown in Figure 1).
- The Patient's EHR (Footer of the screen as shown in Figure 1).
Demographics & Status
The following information is listed for each patient in the header as can be seen in Figure 4.1.
- Demographics, Clinical Status, and Hospital Accommodation Information
- Covid-19 Severity Assessment Indicators
Demographics
Basic patient demographics including name, country, age, gender, and weight are depicted on the leftmost side of the header. Current Patient Status is also rendered.
Patient Status
You can update the current patient status by clicking on the colored label under patient demographics as depicted in Figure 4.2.
The available patient status categories are:
- None
- Covid Suspect Case
- No- ARDS
- ARDS
- Ventilated
- ICU
- Deceased
- Discharged
Accommodation
In the middle header section, information about the hospital, ward, floor, room, and bed number, as well as date of illness (symptoms appearance) is provided. By clicking the Accommodation button, you have the following options as can be seen in Figuge 4.3:
- Hospital: You can select the General Hospital of the following cities: Nicosia, Ammochostos, Limassol, Larnaca and Paphos.
- Ward: You can select the specific ward where the patient is treated from TAEP, Suspect Ward, Covid Positive Ward, ICU Covid Positive, ICU Covid Suspect or specify any Other.
- Floor: You can select the specific floor where the patient is treated.
- Room: You can select the specific room on a given floor that the patient is treated.
- Bed: You can select the specific bed in a given room that the patient is treated.
ARDS - Mews - Glasgow
On the rightmost side of the header section, three clinical severity assessment indicators that have are proposed in the clinical treatment guidelines (therapeutic algorithm) issued by the MOH scientific committee are listed, namely:
The date of last assessment is also displayed.
Add Arterial Blood Gases (ABG)
You can trigger this modal (popup) window by clicking the + button next to the ARDS status (on the right) on the page header or by the Add ABG button in the Daily Monitoring Tab.
The following ABG parameters can be added as depicted in Figure 4.5:
- Registration time: Vital signs date and time registration allows backdated entries to accommodate the scenario where healthcare professionals add these values from hardcoded paper entries that might be kept in parallel.
- Arterial Blood Gases measurements:
- > pH
- > HCO3 (mEq/L)
- > PaCO2 (mmHg)
- > PAO2 (mmHg): It is used in the ARDS severity algorithm computation.
- > SaO2 (%)
- ABG parameters' reference values (ranges) are available in Terminology.
Add Vital Signs (Mews)
You can trigger this modal (popup) window by clicking the + button next to the Mews score (on the right) on the page header or by the Add Vital Signs button in the Daily Monitoring Tab.
The following vital signs parameters can be inserted as depicted in Figure 4.6:
Registration time: Vital signs date and time registration allows backdated entries to accommodate the scenario where healthcare professionals add these values from hardcoded paper entries that might be kept in parallel.
- Vital Signs measurements:
- > Temperature (°C)
- > Respiratory Rate (bpm)
- > Heart Rate (bpm)
- > Systolic/Diastolic Blood Pressures (mmHg)
- > SpO2 (%)
- > Urine Output (ml)
- Vital Signs parameters' reference values (ranges) are available in Terminology.
By clicking the Save button the Vital Signs measurements are stored.
Note: You can insert new Vital Signs measurements without providing an entry for the Urine Output.
In that case, Mews score is computed assigning zero (0) points to Urine Output (see also Modified Early Warning System Score in Terminology.)
However, if a Urine Output measurement is provided, all Vital Signs' fields become mandatory.
Add Glasgow Coma Scale
You can trigger this modal (popup) window by clicking the + button next to the Glasgow score (on the right) on the page header or by the Add GCS button in the Daily Monitoring Tab.
Here, you can select response values using the Glasgow Coma Scale to assess a person's level of consciousness.
The following values to the response categories can be added as depicted in Figure 4.7:
Registration time: Glasgow date and time registration allows backdated entries to accommodate the scenario where healthcare professionals add these values from hardcoded paper entries that might be kept in parallel.
- Glasgow metrics:
-
Eye Opening options:
- None
- To pain
- To speech
- Spontaneous
- None
- Sounds (Incompressible)
- Words (Inappropriate)
- Confused
- Oriented
- None
- Extension to pain (decerebrate)
- Flexion to pain (decorticate)
- Withdraws from pain
- Localizes to pain
- Obeys commands
By clicking the Save button the new GCS value is computed and stored.
Patient Summary
Synoptic View
On the left side of the patient's profile, below the demographics and status header, you can find the Patient Summary, providing a synoptic view of the patient’s health status. The following medical information is summarized as depicted in Figure 4.8:
The labeled number in the orange boxes indicates the number of observations per category.
You can expand and/ or collapse the provided information by clicking on the respective panel's title.
By clicking the + button in the Treatment and Symptoms panels, you trigger the corresponding modal window for updating the relevant information.
Monitoring Charts
In the right side of the patient profile, vital signs and severity indices timeline charts render in a graphical manner the patient’s clinical status over time.
Vital Signs Chart
Vital Signs chart renders the ten most recent vital signs measurements. The latest chart update appears on the top right corner as depicted in Figure 4.10. Next to the timestamp, the Add Vital Signs button triggers the modal window for adding new measurements.
Heart Rate is presented as an orange line chart that indicates the trend of the patient’s heart rate for the last 10 measurements. The horizontal axis (x-axis) shows the date and time of each specific measurement and the vertical axis (y axis) on the left of the graph shows the Heart Rate values as beats per minute (bpm).
Respiratory rate is presented as a dark blue line chart that indicates the trend of the patient’s respiratory rate for the last 10 measurements. The horizontal axis (x-axis) shows the date and time of each specific measurement and the vertical axis (y axis) on the left of the graph shows the Respiratory rate as percentage.
Temperature is presented as a blue line chart that indicates the trend of the patient’s temperature for the last 10 measurements. The horizontal axis (x-axis) shows the days and the vertical axis (y axis) on the right of the graph shows the Temperature values as Celsius degrees.
Systolic blood pressure is presented as a red bar charts that indicate the patient’s systolic blood pressure for the last 10 measurements. The horizontal axis (x-axis) shows the date and time of each specific measurement and the vertical axis (y axis) on the left of the graph shows the Systolic blood pressure as millimeter of mercury (mmHg).
Diastolic blood pressure is presented as a green bar charts that indicate the patient’s diastolic blood pressure for the last 10 measurements. The horizontal axis (x-axis) shows the date and time of each specific measurement and the vertical axis (y axis) on the left of the graph shows the Diastolic blood pressure as millimeter of mercury (mmHg).
If you click on a specific Vital Sign e.g. the Heart Rate label on the top of the graph you will be able to disable that line chart. It you click the label again, then the Heart Rate line graph will be enabled again. The same stands for Temperature, Systolic and Diastolic blood pressure. This will help you of better understanding of the trend of each vital sign during the last 10 measurements.
PaO2/FiO2 chart
| Figure 4.11 [left] depicts the PaO2/FiO2 ratio, an index of arterial oxygenation efficiency that corresponds to ratio of partial pressure of arterial O2 to the fraction of inspired O2. The latter index is used in the computation of ARDS severity. On the top right of the graph you can see the latest update date and time.
If you click on PaO2/FiO2 label on the top of the graph you will be able to disable that line chart. Once you will click on the same label again the graph will be enabled again. |
SpO2(%) and SpO2/FiO2 Chart
Figure 4.11 [right] depicts the SpO2(%) in Green color and the SpO2/FiO2 ratio in Blue color. The left Y-Axis corresponds to the SpO2(%) while the Y-axis on the right captures the SpO2/FiO2 ratio values. The horizontal axis (X-axis) shows the date and time of the measurements. On the top right of the graph the date and time of the most recent update is recorded.
If you click on SpO2 label on the top of the graph you will be able to disable that line chart. Once you click on the same label again, the graph will be enabled again. The same stands for SpO2/FiO2 label.
Electronic Health Record
The Patient's EHR is located at the footer of the Dashboard screen. The Patient's EHR consists of six main categories, organized in a tab menu, as follows:
Daily Monitoring
The Daily Monitoring tab of the patient's EHR is divided in 5 sections namely:
- Vital Signs
- Arterial Blood Gas (ABG)
- Infection-related Indices
- Coagulation Function
- Glasgow Coma Scale Measures
Vital Signs
File:4.12 Vital Signs Daily Monitoring.PNG Figure 4.12: EHR - Daily Monitoring tab - Vital Signs In the Vital Signs section each column entry corresponds to a vital sign measurement, displayed in a chronological order, starting from the most recent. Normal reference values are given in the 2nd column in Figure 4.12 while actual values start from the 3rd column. Every actual value that lies outside the laboratory reference ranges appears in red font colour. The Vital Signs (Mews) table includes the following parameters: Vital Sign Parameters
Also the valid ranges are available in Terminology. Using the "Vital Signs" button located on the top right part, a new, Vital Signs measurement can be added in the modal (pop-up) window as can be seen in Figure 4.5. |
Arterial Blood Gas (ABG)
File:4.13 Arterial Blood Gases Daily Monitoring.PNG Figure 4.13: EHR - Daily Monitoring tab - Arterial Blood Gases (ABG) In Arterial Blood Gas (ABG) Section, the Reference Values (2nd column in Figure 4.13) and the actual values (3rd column onwards in Figure 4.13) for each parameter of the ABG test are shown. The values are displayed in chronological order starting with the most recent. Every actual value that lies outside the reference ranges appears in red font colour. On the top right part of the Arterial Blood Gas section there is a button named "Add ABG" button which pops-up a new window, as shown in Figure 4.4. The values of the Arterial Blood Gas parameters can be added as a new measurement for the current measurement. |
File:4.14 Infection related indices.PNG Figure 4.14: EHR - Daily Monitoring tab - Infection-related Indices In the Infection-related Indices section each column entry corresponds to a Infection-related Index measurement, displayed in a chronological order, starting from the most recent. Normal reference values are given in the 2nd column in Figure 4.14 while actual values start from the 3rd column.
Also the valid ranges are available in Terminology.
|
Coagulation Function
File:4.15 Coagulation fuction Daily Monitoring.PNG Figure 4.15: EHR - Daily Monitoring tab - Coagulation Function Every actual value that lies outside the reference ranges appears in red font colour. |
Glasgow Coma Scale Measures
File:4.16 Glasgow Measures Daily Monitoring.PNG Figure 4.16: EHR - Daily Monitoring tab - Glasgow Measures |
Medication & Treatment
Medication
| As depicted in Figure 4.17 the Medication table shows the following parameters for each medication:
Medication parameters
These fields where taken from the Patient Summary Functional Requirements. Patient Summary is being used in a Pan-European level to support the Patient Summary cross border service. In order for a country to be able to cross-border exchange a Patient Summary, structured and coded information has to be available within the sections of the exchanged Patient Summary. Thus, the medication parameters are all coded. |
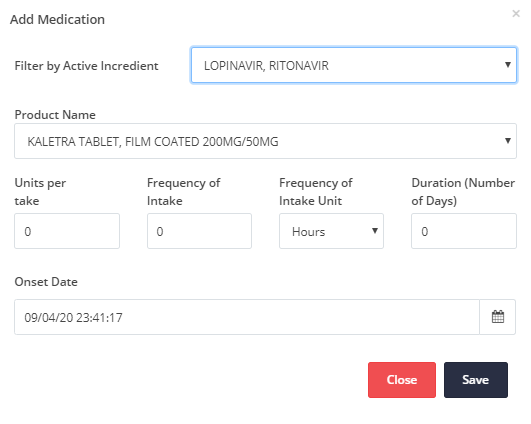
Add Medication
| You have the option to add values of each parameter by clicking the Add medication button, as depicted in Figure 4.18. If the Medication table has many values, you have the ability to view them using the pagination on the bottom of the table. |
Ventilation Treatment
| As can be seen in Figure 4.19 the Treatment table includes information about the current treatment. The parameters of the treatment are:
This section presents the treatments of the patient recorded for specific dates. Most specifically the following treatments are considered:
The date and time parameter defines the day and time of every Treatment set of entries. If the Treatment table has many values, you have the ability to view them using the pagination on the bottom of the table. You can update the treatment by clicking the Update treatment button. More information can be found in Update Treatment. |
Update Treatment
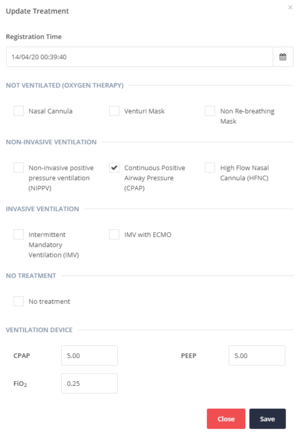
In current Treatment category you have the option to view all the Ventilation Treatment methods which are currently applied on the patient. You can update the current Treatment of the patient as can be seen in Figure 4.9.
The Registration Time is auto completed. However, you can set this field to a different past date or time in order to facilitate the process of transferring a patient's recorded data any time the health provider is available.
For the VENTILATION DEVICE fields write, where applicable, the actual values of the parameters CPAP, PEEP and FI02.
For the rest fields in this screen you have to check or uncheck the following treatment options, based on the patient’s current situation:
-
NOT VENTILATED (OXYGEN THERAPY)
- Nasal Cannula
- Venturi Mask
- Non-invasive positive pressure ventilation (NIPPV)
- High Flow Nasal Cannula (HFNC)
- Continuous Positive Airway Pressure (CPAP)
- Intermittent Mandatory Ventilation (IMV)
- IMV with ECMO
- No treatment
Then you will have to click Save button to save the current Treatment.
Comorbidities & Allergies
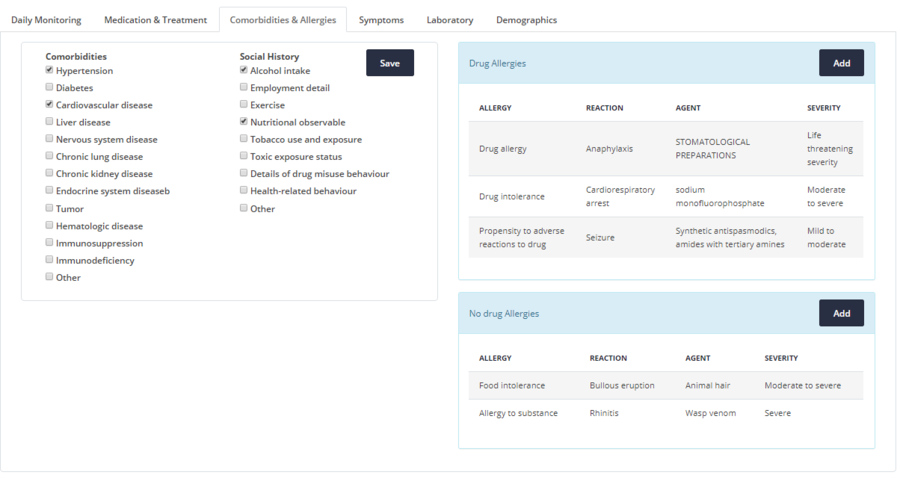
The Comorbidities & Allergies section is divided in two main subsections. The left part presents all the comorbidities and the social history parameters and the right part presents the allergies a patient has.
Comorbidities and Social History
|
Existing patient comorbidities can be added using the available check-boxes. Social History parameters can be added in the same way. If any changes/ updates are made using the checkboxes, the Save button must be clicked. |
Allergies
As can be seen in Figure 4.20 on the right side, the Drug Allergies and No drug Allergies include the following parameters:
- Allergy
- Reaction
- Agent
- Severity
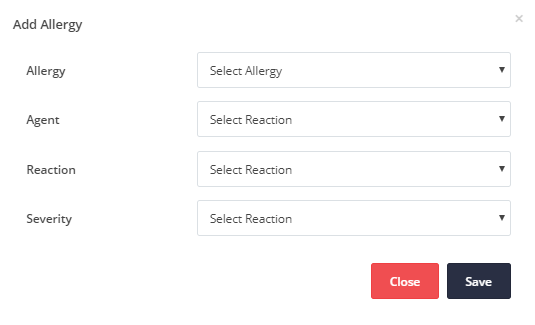
Add allergy
| To add a new Drug allergy, you must click the Add button on the top left of the table. Then a modal (pop-up) windows will be presented to fill in the available values and then click the Save button to add the allergy. The same process stands for adding a new No drug allergy. |
|
|
Patient Symptoms
| The Symptoms Section is organized in a Table with five entries, as shown in Figure 4.22. In the first column, the Date and Time is shown, while in the remaining four columns, the Constitutional, the Upper Respiratory, the Lower Respiratory, the Gastrointestinal and the Neurological symptoms are defined. |
Update Symptoms
| Once you click the "Update Symptoms" button you see a modal (pop-up) window that shows the supported options for each symptom's category as depicted in Figure 4.23. When you will press the Save button a new row in Symptoms table will be added accompanied with the current date and time. |
Laboratory
In this section, the laboratory information is organized in four sub-sections, each one shown as a table. Most specifically the laboratories tests presented are:
- Infection-related Indices [Ranges]
- Coagulation Function [Ranges]
- Hematologic [Ranges]
- Biochemical [Ranges]
All these tables have the same format, which show in the first column the test name, in the second column the reference values of the respective tests and the third column and on, the actual values are displayed in chronological order.
Every actual value that lies outside the reference ranges appears in red font colour.
The description of the following tables can be found in the Daily Monitoring section of this page:
- Infection-related Indices in Daily Monitoring (Infection-related Indices)
- Coagulation Function in Daily Monitoring (Coagulation Function)
The description of the rest tables follows.
Hematologic
| As can be seen in Figure 4.24 the Hematologic table shows the hematologic laboratory measurements of the patient as inputted directly from the Laboratory Information System of the Hospital.
Also, the valid ranges are available in Terminology. |
Biochemical
| As can be seen in Figure 4.25 the Biochemical table shows the biochemical laboratory measurements of the patient as inputted directly from the Laboratory Information System of the Hospital.
Also, the valid ranges are available in Terminology. |
Demographics
The Demographics tab include all the personal necessary data about a specific patient, as shown in Figure 4.1.
Contact Persons
File:4.24 Demographics Contact person.PNG Figure 4.26: EHR - Demographics - Contact Person(s)
If the Contact Persons table has many values, you have the ability to view them using the pagination on the bottom of the table. |


