(Patient Profile) EHR
This section is the Electronic Health Record of the patient. Patient's EHR is located at the footer of the Dashboard screen. The Patient's EHR consists of six main categories, organized in a tab menu. Each one of them is described separately.
Contents
Daily Monitoring
The Daily Monitoring tab of the patient's EHR is divided in 5 sections namely:
- Vital Signs
- Arterial Blood Gas (ABG)
- Infection-related Indices
- Coagulation Function
- Glasgow Coma Scale Measures
Vital Signs
File:4.12 Vital Signs Daily Monitoring.PNG Figure 4.12: EHR - Daily Monitoring tab - Vital Signs In the Vital Signs section each column entry corresponds to a vital sign measurement, displayed in a chronological order, starting from the most recent. Normal reference values are given in the 2nd column in Figure 4.12 while actual values start from the 3rd column. Every actual value that lies outside the laboratory reference ranges appears in red font colour. The Vital Signs (Mews) table includes the following parameters: Vital Sign Parameters
Also the valid ranges are available in Terminology. Using the "Vital Signs" button located on the top right part, a new, Vital Signs measurement can be added in the modal (pop-up) window as can be seen in Figure 4.5. |
Arterial Blood Gas (ABG)
File:4.13 Arterial Blood Gases Daily Monitoring.PNG Figure 4.13: EHR - Daily Monitoring tab - Arterial Blood Gases (ABG) In Arterial Blood Gas (ABG) Section, the Reference Values (2nd column in Figure 4.13) and the actual values (3rd column onwards in Figure 4.13) for each parameter of the ABG test are shown. The values are displayed in chronological order starting with the most recent. Every actual value that lies outside the reference ranges appears in red font colour. On the top right part of the Arterial Blood Gas section there is a button named "Add ABG" button which pops-up a new window, as shown in Figure 4.4. The values of the Arterial Blood Gas parameters can be added as a new measurement for the current measurement. |
File:4.14 Infection related indices.PNG Figure 4.14: EHR - Daily Monitoring tab - Infection-related Indices In the Infection-related Indices section each column entry corresponds to a Infection-related Index measurement, displayed in a chronological order, starting from the most recent. Normal reference values are given in the 2nd column in Figure 4.14 while actual values start from the 3rd column.
Also the valid ranges are available in Terminology.
|
Coagulation Function
File:4.15 Coagulation fuction Daily Monitoring.PNG Figure 4.15: EHR - Daily Monitoring tab - Coagulation Function Every actual value that lies outside the reference ranges appears in red font colour. |
Glasgow Coma Scale Measures
File:4.16 Glasgow Measures Daily Monitoring.PNG Figure 4.16: EHR - Daily Monitoring tab - Glasgow Measures |
Medication & Treatment
Medication
| As depicted in Figure 4.17 the Medication table shows the following parameters for each medication:
Medication parameters
These fields where taken from the Patient Summary Functional Requirements. Patient Summary is being used in a Pan-European level to support the Patient Summary cross border service. In order for a country to be able to cross-border exchange a Patient Summary, structured and coded information has to be available within the sections of the exchanged Patient Summary. Thus, the medication parameters are all coded. |
Add Medication
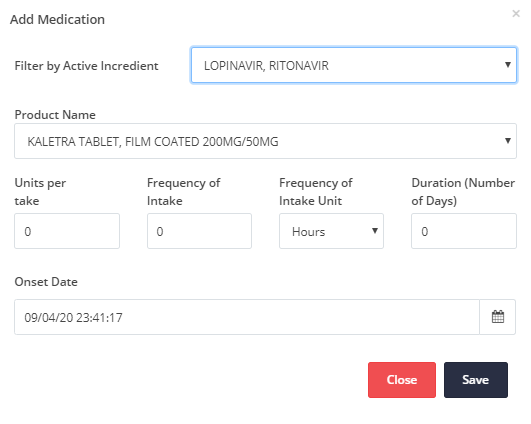
| You have the option to add values of each parameter by clicking the Add medication button, as depicted in Figure 4.18. If the Medication table has many values, you have the ability to view them using the pagination on the bottom of the table. |
Ventilation Treatment
| As can be seen in Figure 4.19 the Treatment table includes information about the current treatment. The parameters of the treatment are:
This section presents the treatments of the patient recorded for specific dates. Most specifically the following treatments are considered:
The date and time parameter defines the day and time of every Treatment set of entries. If the Treatment table has many values, you have the ability to view them using the pagination on the bottom of the table. You can update the treatment by clicking the Update treatment button. More information can be found in Update Treatment. |
Update Treatment
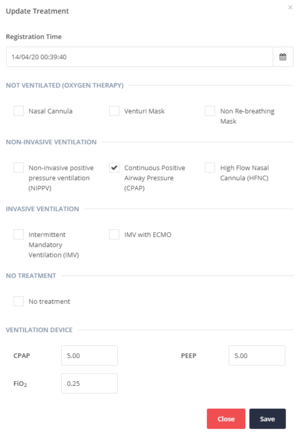
In current Treatment category you have the option to view all the Ventilation Treatment methods which are currently applied on the patient. You can update the current Treatment of the patient as can be seen in Figure 4.9.
The Registration Time is auto completed. However, you can set this field to a different past date or time in order to facilitate the process of transferring a patient's recorded data any time the health provider is available.
For the VENTILATION DEVICE fields write, where applicable, the actual values of the parameters CPAP, PEEP and FI02.
For the rest fields in this screen you have to check or uncheck the following treatment options, based on the patient’s current situation:
-
NOT VENTILATED (OXYGEN THERAPY)
- Nasal Cannula
- Venturi Mask
- Non-invasive positive pressure ventilation (NIPPV)
- High Flow Nasal Cannula (HFNC)
- Continuous Positive Airway Pressure (CPAP)
- Intermittent Mandatory Ventilation (IMV)
- IMV with ECMO
- No treatment
Then you will have to click Save button to save the current Treatment.
Comorbidities & Allergies
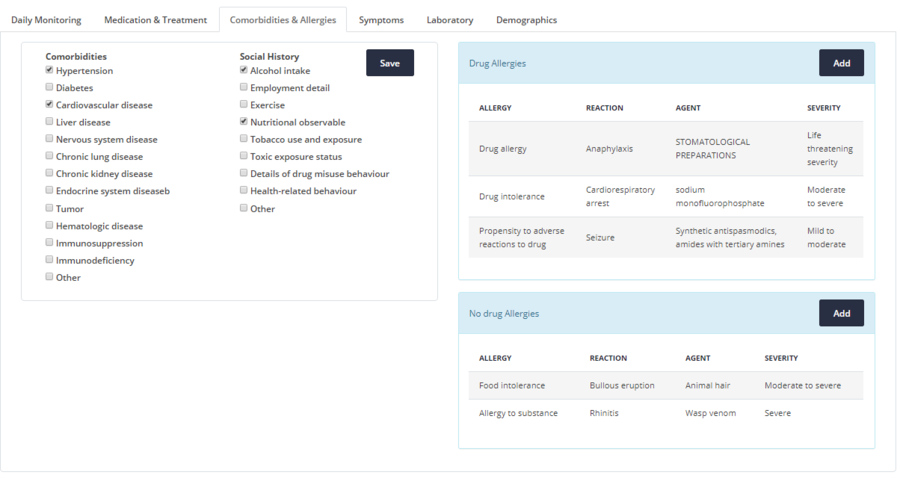
The Comorbidities & Allergies section is divided in two main subsections. The left part presents all the comorbidities and the social history parameters and the right part presents the allergies a patient has.
Comorbidities and Social History
|
Existing patient comorbidities can be added using the available check-boxes. Social History parameters can be added in the same way. If any changes/ updates are made using the checkboxes, the Save button must be clicked. |
Allergies
As can be seen in Figure 4.20 on the right side, the Drug Allergies and No drug Allergies include the following parameters:
- Allergy
- Reaction
- Agent
- Severity
Add allergy
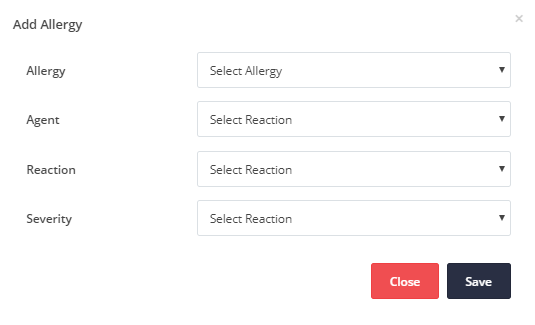
| To add a new Drug allergy, you must click the Add button on the top left of the table. Then a modal (pop-up) windows will be presented to fill in the available values and then click the Save button to add the allergy. The same process stands for adding a new No drug allergy. |
|
|
Symptoms
| The Symptoms Section is organized in a Table with five entries, as shown in Figure 4.22. In the first column, the Date and Time is shown, while in the remaining four columns, the Constitutional, the Upper Respiratory, the Lower Respiratory, the Gastrointestinal and the Neurological symptoms are defined. |
Update Symptoms
| Once you click the "Update Symptoms" button you see a modal (pop-up) window that shows the supported options for each symptom's category as depicted in Figure 4.23. When you will press the Save button a new row in Symptoms table will be added accompanied with the current date and time. |
Laboratory
In this section, the laboratory information is organized in four sub-sections, each one shown as a table. Most specifically the laboratories tests presented are:
- Infection-related Indices [Ranges]
- Coagulation Function [Ranges]
- Hematologic [Ranges]
- Biochemical [Ranges]
All these tables have the same format, which show in the first column the test name, in the second column the reference values of the respective tests and the third column and on, the actual values are displayed in chronological order.
Every actual value that lies outside the reference ranges appears in red font colour.
The description of the following tables can be found in the Daily Monitoring section of this page:
- Infection-related Indices in Daily Monitoring (Infection-related Indices)
- Coagulation Function in Daily Monitoring (Coagulation Function)
The description of the rest tables follows.
Hematologic
| As can be seen in Figure 4.24 the Hematologic table shows the hematologic laboratory measurements of the patient as inputted directly from the Laboratory Information System of the Hospital.
Also, the valid ranges are available in Terminology. |
Biochemical
| As can be seen in Figure 4.25 the Biochemical table shows the biochemical laboratory measurements of the patient as inputted directly from the Laboratory Information System of the Hospital.
Also, the valid ranges are available in Terminology. |
Demographics
The Demographics tab include all the personal necessary data about a specific patient, as shown in Figure 4.1.
Contact Persons
File:4.24 Demographics Contact person.PNG Figure 4.26: EHR - Demographics - Contact Person(s)
If the Contact Persons table has many values, you have the ability to view them using the pagination on the bottom of the table. |


